


Analysis
The actual analysis is complex, so I encourage you to focus on the conclusion above. But if technical analysis is interesting to you, please continue reading.
Until the last century, silver and gold had been money for thousands of years. During the long history of gold and silver, the price ratio of gold to silver has averaged, depending on analysis, around 15 to 20. Since 1975, it has been as low as 17 and as high as about 102. The ratio is low when silver is expensive compared to gold – which occurs at peaks in the price of gold and silver, such as in early 1980. Silver is a smaller market and much more volatile in price than gold, so the ratio can stretch one way or the other depending on the degree of speculative fervor in the market or the degree of price depression and disinterest in precious metals, such as in 1991. Extremes in the ratio usually occur at highs and lows in the prices of both metals.
What I do know is that we can delve deeper into the above SI/GC ratio analysis and come to some high probability predictions that will give us a reasonable degree of safety and security in our quest to buy low and sell high.
Run the same Relative Strength Analysis for the SI/GC ratio, but use a longer time scale – like 40 weeks. Further, average the 40 week RSI numbers over a centered 11 week period, using the current week’s number plus the 5 weeks both before and after the current week. The result is a smoothed RSI that is centered about the relevant week in the analysis. (Clearly, the last few weeks in the series are not using the future RSI values.) This removes much of the short-term “noise” – the weekly fluctuations that mean nothing in the long term.
Calculate the 65 week simple moving average (add the prices for the last 65 weeks and divide by 65) of the actual gold prices. This produces a long-term trend for gold prices that has removed all but major fluctuations in price.
Calculate the 7 week simple moving average of the actual gold prices. This gives a short-term average that is much more volatile than the 65 week moving average.
Subtract the 65 week average from the 7 week average. Then divide by the 65 week average. This produces a percentage above or below the long-term trend of the 65 week moving average for gold. This is important because it measures a deviation from average in percentage terms, but not in actual gold prices, which have varied over the past 12 years from about $255 per ounce to $1923 per ounce. Further, it relates the percentage (over or under) to a long-term moving average, which accounts for both bear and bull markets in gold prices.
Graph the 40 week (centered) RSI of the SI/GC ratio against the percentage that the 7 week moving average of prices is above or below the 65 week moving average of prices (percentage of price deviation or PPD). The graphs of both are similar as to direction, highs, and lows.
Examine the graphs of both the RSI and the percentage of price deviation. You will find that major lows and highs in the RSI and percentage price deviation (PPD) occur roughly every 18-24 months, but the timing is not consistent enough that you would trade on these cycles. A chart since 1975 will not display well due to the amount of data. However, the following chart (data since 2005 is more manageable) shows the correlation between the RSI of the SI/GC ratio and the percentage of price deviation in gold.
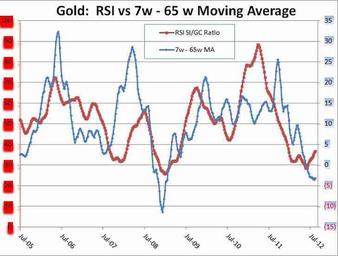
Further, you will see that peaks in the PPD occur between 45 and 60 weeks after their lows and that the PPD peaks rise to an average (since 1/1/2005) of about 27%. This means that the 7 week moving average, less the 65 week moving average of price, divided by the 65 week moving average of price, peaks around 27% – perhaps 20% some years and perhaps 33% other years.
The bottoms in the RSI, after being smoothed so much, are always at or near (on a weekly scale) important bottoms in price, which occur approximately every 18-24 months.
Finally, note that an important bottom in the RSI occurred in May 2012, and that it was the second most oversold bottom in the past 12 years.
 American Eagle Silver Coins
Price : $34.80 - $37.16
American Eagle Silver Coins
Price : $34.80 - $37.16
 Krugerrand Gold Coins
Price : $1,726.00 - $1,794.78
Krugerrand Gold Coins
Price : $1,726.00 - $1,794.78 Gold Money Silver Bullion
Price : $32.91 - $32.91
Gold Money Silver Bullion
Price : $32.91 - $32.91
 PAMP Suisse 100 gram Gold Bars
Price Range : $5,579.95 - $5,648.46
